Surveying the series of stars from the coolest to the hottest, we can trace how the calcium atoms are at first whole, then singly ionized, then doubly ionized -- a sign that the battering becomes more severe as the heat becomes more intense. (The last stage is indicated by the disappearance of all visible signs of calcium, because the ion with two electrons missing has no lines in the observable part of the spectrum.) The progressive change of other elements is shown in a similar way. A great advance in this study was made in 1920 by Professor M. N. Saha, who first applied the quantitative physical laws which determine the degree of ionization at any given temperature and pressure. He thereby struck out a new line in astrophysical research which has been widely developed. Thus, if we note the place in the stellar sequence where complete calcium atoms give place to atoms with one electron missing, the physical theory is able to state the corresponding temperature or pressure.[Note: It does not give _both_ temperature and pressure, but it gives one if the other is known. This is valuable information which may be pieced together with other knowledge of the conditions at the surface of the stars.] Saha's methods have been improved by R. H. Fowler and E. A. Milne. One important application was to determine the surface temperatures of the hottest types of stars (12,000degrees - 5,000degrees), since alternative methods available for cooler stars are not satisfactory at these high temperatures. Another rather striking result was the discovery that the pressure in the star (at the level surveyed by the spectroscope) is only 1/10,000th of an atmosphere; previously it had been assumed on no very definite evidence to be about the same as that of our own atmosphere.
We commonly use the method of spectrum analysis when we wish to determine which elements are present in a given mineral on the earth. It is equally trustworthy in examining the stars since it can make no difference whether the light we are studying comes from a body close at hand or has travelled to us for hundreds of years across space. But one limitation in stellar work must always be remembered. When the chemist is looking, say, for nitrogen in his mineral, he takes care to provide the conditions which according to his experience are necessary for the nitrogen spectrum to show itself. But in the stars we have to take the conditions as we find them. If nitrogen does not appear, that is no proof that nitrogen is absent; it is much more likely that the stellar atmosphere does not hit off the right conditions for the test. In the spectrum of Sirius the lines of hydrogen are exceedingly prominent and overwhelm everything else. We do not infer that Sirius is composed mainly of hydrogen; we infer instead that its surface is at a temperature near 10,000 degrees, because it can be calculated that that is a temperature most favourable for a great development of these hydrogen lines. In the sun the most prominent spectrum is iron. We do not infer that the sun is unusually rich in iron; we infer that it is at a comparatively low temperature near 6,000 degrees favourable for the production of the iron spectrum. At one time it was thought that the prominence of hydrogen in Sirius and of metallic elements in the sun indicated an evolution of the elements, hydrogen turning into heavier elements as the star cools from the Sirian to the solar stage. There is no ground for interpreting the observations in that way; the fading of the hydrogen spectrum and the increase of the iron spectrum would occur in any case as the result of the fall of temperature; and similar spurious appearances of evolution of elements can be arranged in the laboratory.
It is rather probable that the chemical elements have much the same relative abundance in the stars that they have on the earth. All the evidence is consistent with this view; and for a few of the commoner elements there is some positive confirmation. But we are limited to the outside of the star as we are limited to the outside of the earth in computing the abundance of the elements, so that this very provisional conclusion should not be pressed unduly.
Spectral Series

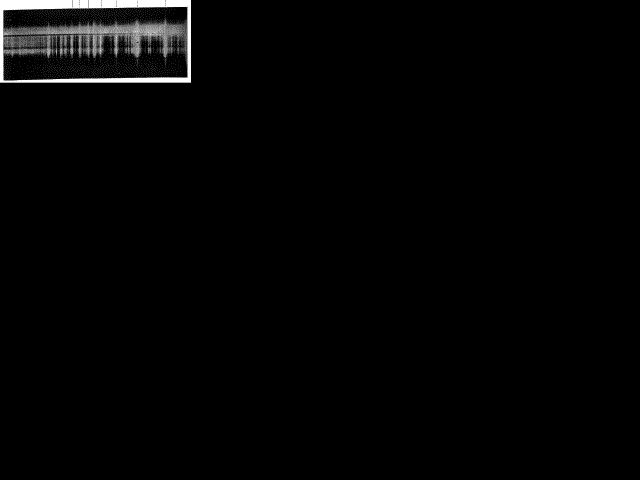
Fig 9. Flash Spectrum of Chromosphere showing Head of the Balmer Series. (British Eclipse Expedition, 14 Jan. 1926)
To illustrate further this kind of deduction, let us consider the spectrum shown in Fig. 9 and see what may be learnt from it. With a little trouble we can disentangle a beautifully regular series of bright lines. The marks above will assist you to pick out the first few lines of the series from the numerous other spectra mixed up with it. Noticing the diminishing spacing from right to left, you will be able to see that the series continues to the left for at least fifteen lines beyond the last one marked, the lines ultimately
| Previous chapter/page | Back | Home | Email this | Search | Discuss | Bookmark | Next chapter/page |